Sizing the Massachusetts Marijuana Market
Proprietary NewCann Research – Updated October 2019
Summary
NewCann estimates the fully-developed Massachusetts adult-use market ($) potential at $2 billion. We presently expect the market will reach this point by 2024 or 2025. Our analysis follows.
To develop this estimate, we sought to identify a proxy state for Massachusetts adult-use legal marijuana consumption. Below we explore market similarities, attempt to quantify per capita consumer purchase values, translate this data to Massachusetts, and discuss other influencing factors. As we review below, we selected Colorado as our proxy as it shares many similarities to Massachusetts.
.If you're reading this on a phone screen, tip the screen sideways to read the tables.
Political attitude toward marijuana
Colorado residents legalized recreational marijuana by a voter initiative in 2012 (55.3% yes), Massachusetts residents followed a similar path in 2016 (53.7% yes). (Statewide voter-initiative legalization efforts are typically prosecuted during presidential election cycles, hence the four year time variance.) Colorado is often cited as the most established regulated adult-use market in the United States. With similar political leanings toward marijuana legalization and similar demographics (discussed below), Colorado marijuana consumption serves as a good comparison for estimating Massachusetts marijuana consumption.
Headcount
In 2017, at the last U.S. Census estimate, Colorado had 5.6 million residents (21st largest) versus 6.86 million in Massachusetts (15th largest) – relatively similar size. The five intermediate states between 15 and 21 are not established adult-use markets (TN, IN, MO, MD, WI). Several larger marijuana-legal states have a less restrictive regulatory and enforcement framework that we do not believe reflect the Massachusetts market.
Who lives there – age, smarts, and money
Colorado’s age distribution population mirrors Massachusetts. 33% of their population is age 25 or under as compared to 32% for Massachusetts. Thereafter, the age distribution is nearly identical.
|
Age Distribution |
0-18 |
19-25 |
26-34 |
35-54 |
55-64 |
65+ |
|
Colorado |
24% |
9% |
14% |
26% |
12% |
15% |
|
Massachusetts |
22% |
10% |
14% |
26% |
14% |
15% |
Educationally, the two states are very similar in education based on national rankings.
|
Education |
H.S. Diploma |
Rank |
Bachelor’s Degree |
Rank |
Advanced Degree |
Rank |
|
Colorado |
90.7% |
14 |
38.1% |
2 |
14.0% |
7 |
|
Massachusetts |
89.8% |
19 |
40.5% |
1 |
17.7% |
1 |
There is a variance in income with Massachusetts enjoying the lead, though Massachusetts also carries a higher cost of living.
|
Income |
Median Household Income |
|
Cost of Living Index |
|
|
Colorado |
$65,685 |
|
131.5 |
|
|
Massachusetts |
$75,297 |
|
139.0 |
|
For a Massachusetts household to enjoy the same standard of living as a median Colorado household, due to the higher cost of living in the Bay State, a Massachusetts household would need to earn $69,431[1].
|
|
Colorado |
Massachusetts |
|
Colorado Median Household Income |
$65,685 |
|
|
Colorado Cost of Living Index |
131.5 |
|
|
Baseline Household Income |
$49,951 |
$49,951 |
|
Massachusetts Cost of Living Index |
|
139.0 |
|
Comparable Massachusetts Median Household Income |
|
$69,431 |
However, Massachusetts households have greater purchasing power, even when adjusted for a higher cost of living. In Massachusetts, the average household income is $75,297; 8.45% greater than the $69,431 cost of living adjusted household income to be comparable to a Colorado household, translating to greater discretionary purchasing power. We discuss discretionary purchasing power further below.
With similar demographics, attitudes toward marijuana, and purchasing power, we next estimate projected revenue levels.
Projecting revenue levels
The metric we seek is projected annual Massachusetts marijuana sales revenue. Understanding sales per capita can be tricky. It isn’t only residents that purchase marijuana. Vacationers, visitors, and other non-residents, purchase marijuana. Our first step is to determine the appropriate headcount.
As the table further below shows, Colorado is projected to have 5.771 million residents in 2019. We have to consider out-of-state student populations, purchasers who travel to Colorado from adjoining states, and out-of-of state visitors to estimate a reasonable headcount.
Out-of-state student population
With high levels of educational achievement in Colorado and Massachusetts, consideration must be given to student populations. Colorado's higher education system is composed of 87 colleges and universities while Massachusetts' higher education system is composed of 125 colleges and universities. While both states have a minimum legal age to purchase adult-use marijuana of 21 years old, there are still material levels of out-of-state college students whose age exceeds that threshold. In 2014, Massachusetts had approximately 172,600 college students. However, we could not locate data on in-state versus out-of-state student counts (we do not want to double-count a Massachusetts resident who is also a student). Assuming for discussion that (a) half of all students are out-of-state; (b) that student head count between the two states is correlated to the number of colleges and universities; and (c) as much as 50% of students are 21 years of age or older, we would estimate no more than $12 million of incremental statewide revenues in Massachusetts from college students. If it is assumed college aged students will consume recreational marijuana at 2x the typical resident (a wild guess), Colorado students could potentially contribute $16.5 million to annual statewide sales; not enough to move the needle for a $1.5 to $1.7B+ market.
|
MA Students |
172,600 |
|
50% Out-of-State |
86,300 |
|
50% 21+ |
43,150 |
|
Sales per Resident |
$275.14 |
|
Consumption Rate |
200% |
|
MA Revenue Variance |
$23,744,789 |
|
Colorado Higher Ed Institutions |
87 |
|
Massachusetts Higher Ed Institutions |
125 |
|
Assumed Correlation |
70% |
|
CO Revenue Variance |
$16,526,373 |
Cross-border purchasers
We next considered the potential impact of neighboring states upon long-term revenue levels.
Colorado is bordered by seven states; Wyoming and Nebraska to the north, New Mexico and Oklahoma to the south, Nebraska and Kansas to the east, and Utah to the west. The southwest corner of Colorado meets Utah, Arizona, and New Mexico. This spot is known as Four Corners. None of these border states have legalized marijuana for recreational use (see the smoking joint in Colorado image). The southern and western neighbors have legalized marijuana for medical use (“+”). Colorado shares approximately 1,320 miles of border with its seven neighbors; Massachusetts shares less than 250 miles with its five neighbors. We could not locate any data from the Colorado Department of Revenue, Marijuana Enforcement Division as to the level of out-of-state purchasers. Therefore we reviewed two Colorado maps; a population density map and a map of major roadways. Both maps are shown below.
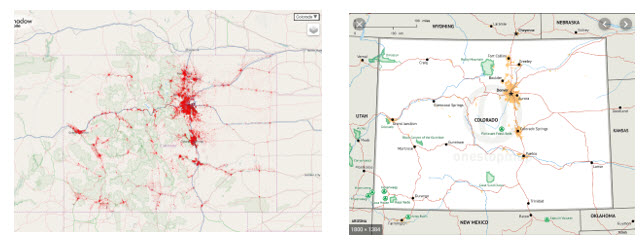
Cheyenne is the most populated municipality in Wyoming with approximately 66,000 people. The state of Wyoming has approximately 578,000 residents (compare this to Boston which has a population of 685,094). If all Cheyenne residents consumed marijuana at the same rate as Colorado residents AND all Cheyenne residents travel to Colorado to purchase recreational marijuana, it would have an approximate $18MM retail value. We researched population levels in eastern Utah along the major roadways into Colorado. While Utah has a population of 3.16MM residents, the eastern communities we identified as being close to the red zones on the above Colorado population density map appear to have approximately 12,450 residents. This equates to no more than $3.4MM of retail sales, using a similar approach as applied to Cheyenne. Sidney, Nebraska has a population under 7,000 people. In light of the overall land mass and population density levels in that area of the U.S., our analysis satisfied us that it is unlikely that neighboring state purchasers are materially contributing to Colorado’s overall retail marijuana sales (+ - <5%).
Visitors
States track annual visitor counts. This is most likely by reportable lodging rooms. Hotel rooms would be counted but off-market lodging such as friends, Craigslist, VRBO, AirBnB, likely are not counted. Furthermore, Colorado is a large state. A business traveler doing business in another part of the state might stay at a hotel overnight, even if they are a Colorado resident. We could find no data to discern how many of these visitors are actually Colorado residents. For our purposes, we decided off-market visitors might balance in-state hotel guests and we would use the state’s published visitor count of 86 million.
We could find no data on average length of a hotel stay in Colorado and so conducted a highly unscientific survey and settled upon the assumption that overall, visitors stay, on average, 2 ½ days each and have similar marijuana purchasing habits as a typical Colorado resident. This creates the same effect as increasing the annual population headcount by 589,000 people[2].
Colorado Marijuana Sales Level
It took Colorado four years for its marijuana sales to effectively level off (though Colorado has recently experienced an increase from 2018 to 2019, driven by double-digit growth for the months of May through August). Massachusetts is off to a slow start and therefore, it will likely take four to five years (through 2024) for the state to achieve full retail market penetration. The chart below shows Colorado retail sales for fiscal years 2014 through 2018 and the projected fiscal year 2019 revenue level based upon sales through the end of August.
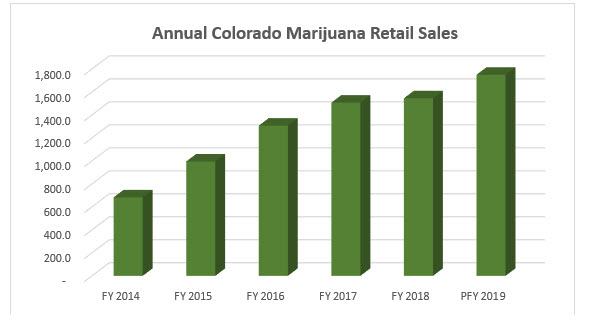
Based upon Colorado sales through August, it appears full year 2019 sales will exceed full year 2018 sales by at least 13.2%.
|
Year |
Annual Revenue |
Annual Gain |
Growth |
|
FY 2014 |
$683,523,739 |
|
|
|
FY 2015 |
$995,591,255 |
$312,067,516 |
45.7% |
|
FY 2016 |
$1,307,203,473 |
$311,612,218 |
31.3% |
|
FY 2017 |
$1,507,702,219 |
$200,498,746 |
15.3% |
|
FY 2018 |
$1,545,691,080 |
$37,988,861 |
2.5% |
|
PFY[3] 2019 |
$1,749,791,755 |
$204,100,675 |
13.2% |
|
Jan - Aug |
|
|
|
|
2018 |
$1,022,245,511 |
|
|
|
2019 |
$1,157,227,851 |
$134,982,340 |
13.2% |
|
|
|
|
|
The following table shows that Colorado sales have been experiencing double digit gains every month, since May 2019. The overall increase from May through August is 19.2%. If that average holds steady through the end of 2019, we can expect 2019 sales to exceed 2018 sales by 14.7%. We have applied the more conservative 13.2% in the graph above.
MONTHLY MARIJUANA SALES: 2018 versus 2019
|
Month |
2018 Monthly |
2018 YTD |
2019 Monthly |
2019 YTD |
Monthly |
YTD |
|
Jan |
$117,993,222 |
$117,993,222 |
$124,874,274 |
$124,874,274 |
5.8% |
5.8% |
|
Feb |
$112,509,517 |
$230,502,739 |
$119,407,860 |
$244,282,134 |
6.1% |
6.0% |
|
Mar |
$135,183,956 |
$365,686,695 |
$142,415,604 |
$386,697,738 |
5.3% |
5.7% |
|
Apr |
$124,309,879 |
$489,996,574 |
$135,882,169 |
$522,579,907 |
9.3% |
6.6% |
|
May |
$122,868,216 |
$612,864,790 |
$143,107,279 |
$665,687,186 |
16.5% |
8.6% |
|
Jun |
$129,523,030 |
$742,387,820 |
$152,026,091 |
$817,713,277 |
17.4% |
10.1% |
|
Jul |
$138,535,584 |
$880,923,404 |
$166,294,715 |
$984,007,992 |
20.0% |
11.7% |
|
Aug |
$141,322,108 |
$1,022,245,512 |
$173,219,859 |
$1,157,227,851 |
22.6% |
13.2% |
Data Source: Colorado Department of Revenue
|
May - Aug |
$532,248,938 |
|
$634,647,944 |
|
19.2% |
Massachusetts Marijuana Revenue Projections
|
|
Colorado |
Mass. |
|
|
Colorado |
Mass. |
|
2018 Marijuana Sales |
$1.546B |
Proj.2019 |
$1.750B |
|
||
|
Residents |
5.68MM |
6.890MM |
Proj.2019 |
5.771MM |
6.939MM |
|
|
Visitors[4] |
86.000MM |
30.100MM |
Actual 2018 |
86.000MM |
30.100MM |
|
|
Resident Equivalent[5] |
.589MM |
.206MM |
|
.589MM |
.206MM |
|
|
Effective Headcount |
6.269MM |
7.096MM |
|
6.360MM |
7.146MM |
|
|
Sales per Head |
$246.56 |
|
|
$275.14 |
|
|
|
Comparable Sales |
$1,749.63 |
|
|
$1,966.04 |
 $246.56
 $275.14
Other Considerations
Population Density
In terms of physical land mass, Colorado dwarfs Massachusetts (table below). As a matter of fact, Colorado could absorb not just Massachusetts, but all 71,992 square miles of New England, and still have room for a few cases of Harpoon beer, some Legal Seafood’s Chowdah, and a few wicked good pints of Ben & Jerry’s. Resident count per square mile translate into more residents within reasonable driving distance to a marijuana store. Higher population density will eventually favor legal retail sales over black market retail sales as retail outlets will be within shorter driving distance in higher density states (assuming legal prices find a lower equilibrium).
|
Population Density |
Rank by Population |
Rank by Population Density |
Residents per Square Mile |
Square Miles |
|
Colorado |
22 |
37 |
52 |
103,642 |
|
Massachusetts |
15 |
3 |
871 |
7,800 |
Based upon all of the foregoing, assuming comparable retail pricing, a fully developed Massachusetts market should represent a near $2 billion opportunity.
Discretionary household income impact
One other factor must be considered. Massachusetts residents enjoy a household income level that is 8.45% higher than that of Colorado households. Disposable income is household income after taxes are paid. Discretionary income is household income after taxes and other necessities, such as housing, food, clothing, car payments, etc. Discretionary income is difficult to determine on a localized level (by state), but many experts suggest 30% of personal earnings are discretionary. Since the cost of living adjustment has already taken into consideration the higher cost of living in Massachusetts versus Colorado, the 8.45% income boost, when applied only to discretionary income, actually provides Massachusetts households with an approximate 28.2% greater discretionary budget than Colorado households. Recreational marijuana is clearly a discretionary item. This indicated a positive bias toward our projections. A consumer having 8.45% more income does not mean they will purchase more marijuana, but it does make marijuana more affordable for consumers interested in the product.
Average Market Rate (AMR)
At $1.966 billion, the market is expressed in dollars, not pounds. A major influencing factor on market size ($) is price per pound (known as the Average Market Rate, or simply the “AMR”). Marijuana spot pricing varies widely. It is the only commodity that cannot be transported legally across state lines. That means pricing is local. Colorado’s projected 2019 $1.75 billion market is a function of the local Colorado AMR. Massachusetts has opened with strong pricing but as more cultivation facilities are licensed and reach the harvest stage, the AMR will eventually drop. In October 2018, a Massachusetts CEO shared that they are working to drive their then current (2018) $1,500 cost per pound down to $300 by the end of 2019. While consumers may buy more marijuana product as the AMR drops, the relationship is not likely to be linear. However, lower prices will likely drive more consumers from the black market to the legal market.
PriceofWeed.com reports (Oct 2019) that the average cost per ounce of high quality marijuana is $340.07 in Massachusetts (5,771 sample size) versus $241.27 in Colorado (4,144 sample size); 41% higher in Massachusetts. Medium quality product follows a similar premium (41% higher) (these percentages are generally unchanged since our initial analysis in January, 2019). At similar levels of consumption, the overall market will be influenced by the AMR. However, the AMR will decrease as more cultivators begin to produce and harvest product. Otherwise, the Massachusetts market would be closer to $2.5 to $2.8 billion – an unlikely event.
For all of the foregoing reasons, we believe the Massachusetts marijuana market has a $1.75 billion to $2.0 billion market potential and will require four to five years to reach that level.
Where did we get our information?
- Population data: United States Census Bureau, State Population Totals and Components of Change: 2010-2017.
- 2019 population estimates:
- http://worldpopulationreview.com/states/colorado-population/
- http://worldpopulationreview.com/states/massachusetts-population/
- Cost of Living Index: BestPlaces.net
- Education: United States Census Bureau, American Fact Finder, S1501 Educational Attainment, 2011-2015 American Community Survey 5-Year Estimates
- Age Distribution: Henry J. Kaiser Family Foundation, Population Distribution by Age (2016)
- Population Density: United States Census Bureau, American Fact Finder, PEPANNRES Annual Estimates of the Resident Population: April 1, 2010 to July 1, 2015, 2015 Population Estimates
- AMR: PriceOfWeed.com
- Colorado Revenue: Colorado Department of Revenue
- College enrollment estimates: https://www.mass.edu/datacenter/2016enrollmentestimates.asp
- Higher education institution counts:
- Tourism:
Questions? Tell us how you feel, are we right or off somwhere? Let David know at...
Contact the author:
David Rabinovitz
LinkedIn: https://www.linkedin.com/in/davidrabinovitz/
[1] ($65,685 / 1.315 = $49,951. $49,951 x 1.390 = $69,431)
[2] 86 million guests x 2 ½ days, divided 365 days, equals resident equivalent headcount
[3] PFY = Projected Fiscal Year
[4] Colorado welcomed a record 86.0 million visitors in 2018, up from an unprecedented 84.7 million visitors in 2017, and up from the 82.4 million who visited in 2016. Comparatively, Massachusetts welcomed 30.1 million visitors in 2018, up from 28.3 million visitors in 2017.
[5] For our purposes, we assume each visitor stays for 2 ½ days. There is no statistical data to support this 2 ½ day assumption. We multiply the number of visitors (86MM) by 2.5 days, and divide the total day count (215MM) by 365 days to arrive at equivalent residential headcount of 589,000 residents.
MASSACHUSETTS CANNABIS, REAS THESE...

HOW LANDLORDS CONTROL MARIJUANA LICENSING IN MASSACHUSETTS
OR..

MASSACHUSETTS CANNABIS DELIVERY RULES AND REGS
OR..
HOW MARIJUANA LICENSING WORKS IN MASSACHUSETTS, CLICK HERE.
OR..
MASSACHUSETTS HOST COMMUNITY AGREEMENTS, UGH!
OR...